The PDGM Dashboard provides insights at the patient level.
PDGM Case-Mix Analysis ($)
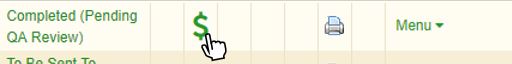
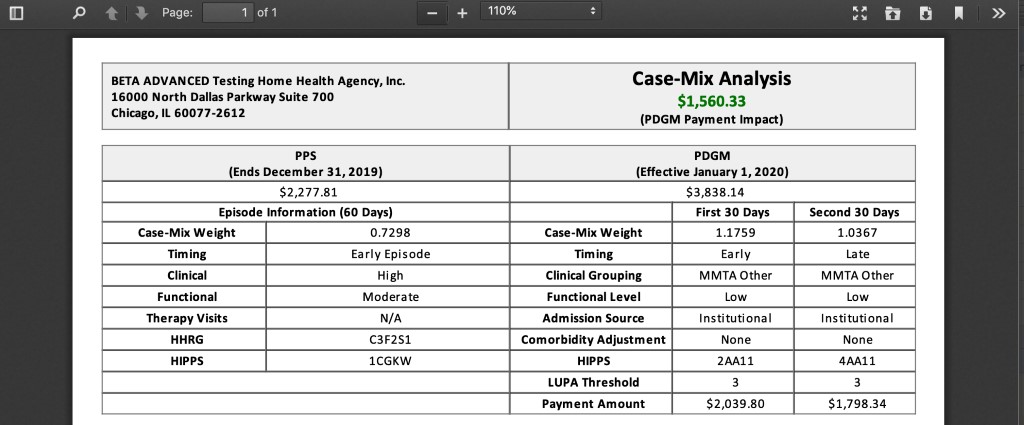
The PDGM Case-Mix Analysis feature compares the agency’s revenue for a single patient under PPS to the projected revenue under PDGM. Once an OASIS is complete, users can view the PDGM Case-Mix Analysis by clicking the green dollar sign symbol next to the completed OASIS assessment in the Schedule Center.
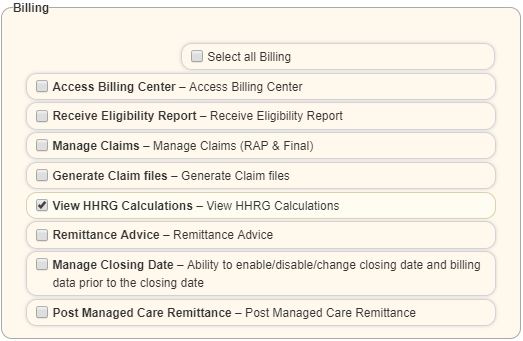
Permission to view this feature is given in the Permissions tab when adding or editing a user. To give a user this permission, select the Admin tab ➜ Lists ➜ Users. In the Users list, find the appropriate user and select Edit. Select the Permissions tab on the left-side menu. Scroll to the Billing section on the right side of the Permissions screen, and select View HHRG Calculations. Click Save. The user will then be able to view the PDGM Case-Mix Analysis in the Schedule Center.
The analysis will enable you to see HHRG scores under PPS and PDGM and prepare for accurate coding, LUPA thresholds for each 30-day payment period, and proper visit utilization under PDGM.
Click the video below to watch an overview of the PDGM Case-Mix Analysis feature:
Gross Margin Calculator
The Gross Margin Calculator shows your agency’s gross profit and loss so you can adhere to predetermined gross margin percentages and evaluate care and utilization more closely. It assists with financial operations by ensuring the proper steps are taken upfront to encourage accountability and communication between financial and clinical operations.
All users with access to the Quality Assurance (QA) Center can open the Gross Margin Calculator when reviewing OASIS documentation.
The following items are available in the in the Gross Margin Calculator and explained further below:
OASIS Episode Information
Cost Modeling
Cost Payment Projection
OASIS Case-Mix Analysis
OASIS Episode Information
This section includes information that is generated from the OASIS assessment.
When the Gross Margin Calculator is first opened, the following fields are generated by the OASIS assessment: Home Health Resource Group (HHRG), Expected Payment, Total Cost, and Gross Profit (Margin).
The OASIS Case-Mix Analysis section on the right side lists Functional and Clinical OASIS items used to produce the HHRG score.
Episode Payment is based on the case-mix rate.
Total Cost is based on the number of visits and average discipline cost per visit.
Average Discipline Cost Per Visit X Number of Visits = Total Cost
(Average discipline cost per visit is identified in Manage Company Information under the Admin tab.)
Expected Payment includes Therapy Visits (M2200).
The HHRG score can be adjusted in two ways:
1) Use the Cost Modeling tool to adjust the number of therapy visits, then update Therapy Visits (M2200) in the OASIS assessment.
2) Update the Clinical and Functional items in the OASIS assessment.
Once the OASIS assessment is updated, the information in the Gross Margin Calculator will automatically update to reflect the changes.
Cost Modeling
The visits for each discipline are based on the visit frequency entered by the clinician in the OASIS assessment. If M2200 is greater than zero, the therapy visits will need to be readjusted according to your agency policies and procedures, since most clinicians write a frequency of 1w1 for evaluation and treatment.
If the case-mix analysis does not support the number of visits requested by the clinician, the frequency may be adjusted here, and then must be corrected in the OASIS assessment to ensure the Plan of Care is updated.
The frequency times the average cost per discipline plus the supplies equals the total cost of the patient’s care.
Frequency X Average Cost Per Discipline + Supplies = Total Cost
The average cost per discipline is pulled from Manage Company Information and should be based on numbers from the agency’s cost report, which includes visit cost plus overhead.
Non-routine supplies (NRS) are included in the expected payment. The supplies field available in Cost Modeling gives the ability to add additional supply expenses to the total cost.
Anytime the Gross Margin Calculator is reopened, the information is automatically refreshed with data that is currently in the OASIS assessment.
Payment Projection
The case-mix rate is adjusted when the therapy visits are adjusted in the Cost Modeling section, when there are outliers or LUPAs (based on the number of discipline visits) and when the OASIS items are corrected in the assessment.
Anytime the Gross Margin Calculator is reopened, the information is automatically refreshed with data that is currently in the OASIS assessment.
When the Gross Margin Calculator is first opened, the expected payment, total cost and gross profit (margin) represent what was generated by the OASIS assessment. When adjustments are made in the Cost Modeling section, the adjusted expected payment, total cost, and gross profit/loss and gross margin will be reflected here.
The expected payment is based upon the case-mix rate minus the total cost.
Case-Mix Rate – Total Cost = Expected Payment
OASIS Case-Mix Analysis
Case-mix information is based on the completed OASIS assessment Reviewing the case-mix in relation to the HHRG allows agencies to take a closer look at utilization.
The case-mix analysis includes the following sections: Clinical Points, Functional Points and Non-Routine Supplies (NRS) Points.
Clinical Points:
Based on the PPS calculation.
Includes case-mix diagnoses entered in M1021 and M1023, and selected OASIS items based on episode sequence and therapy utilization.
Other OASIS items that are part of the case-mix based on episode sequence and therapy utilization include:
M1030- Therapy at Home response 1, 2 or 3
M1200- Vision response 1 or more
M1242- Pain response 3 or 4
M1311- 2 or more pressure ulcers at stage 3 or 4
M1324- Most problematic pressure ulcer response 1, 2, 3 or 4
M1334- Stasis ulcer status response 2 or 3
M1342- Surgical wound status response 2 or 3
M1400- Dyspnea response 2, 3, or 4
M1620- Bowel Incontinence response 2 through 5
M1630- Ostomy response 1 or 2
M20230- Injectable Drug Use does not produce points in the case-mix
Functional Points:
Based on the PPS calculation for the following OASIS items:
M1810 or M1820- Dressing upper or lower body response 1, 2 or 3
M1830- Bathing response 2 or greater
M1840- Toileting transferring response 2 or more
M1850- Transferring response 2 or more
M1860- Ambulation response 1, 2, 3 or 4
Non-Routine Supplies (NRS) Points:
The table below demonstrates the total points for the corresponding therapy visits and episode that produce the Home Health Resource Group (HHRG):